❋
IBM Mobile Asset Optimization
A Vodafone & IBM joint solution
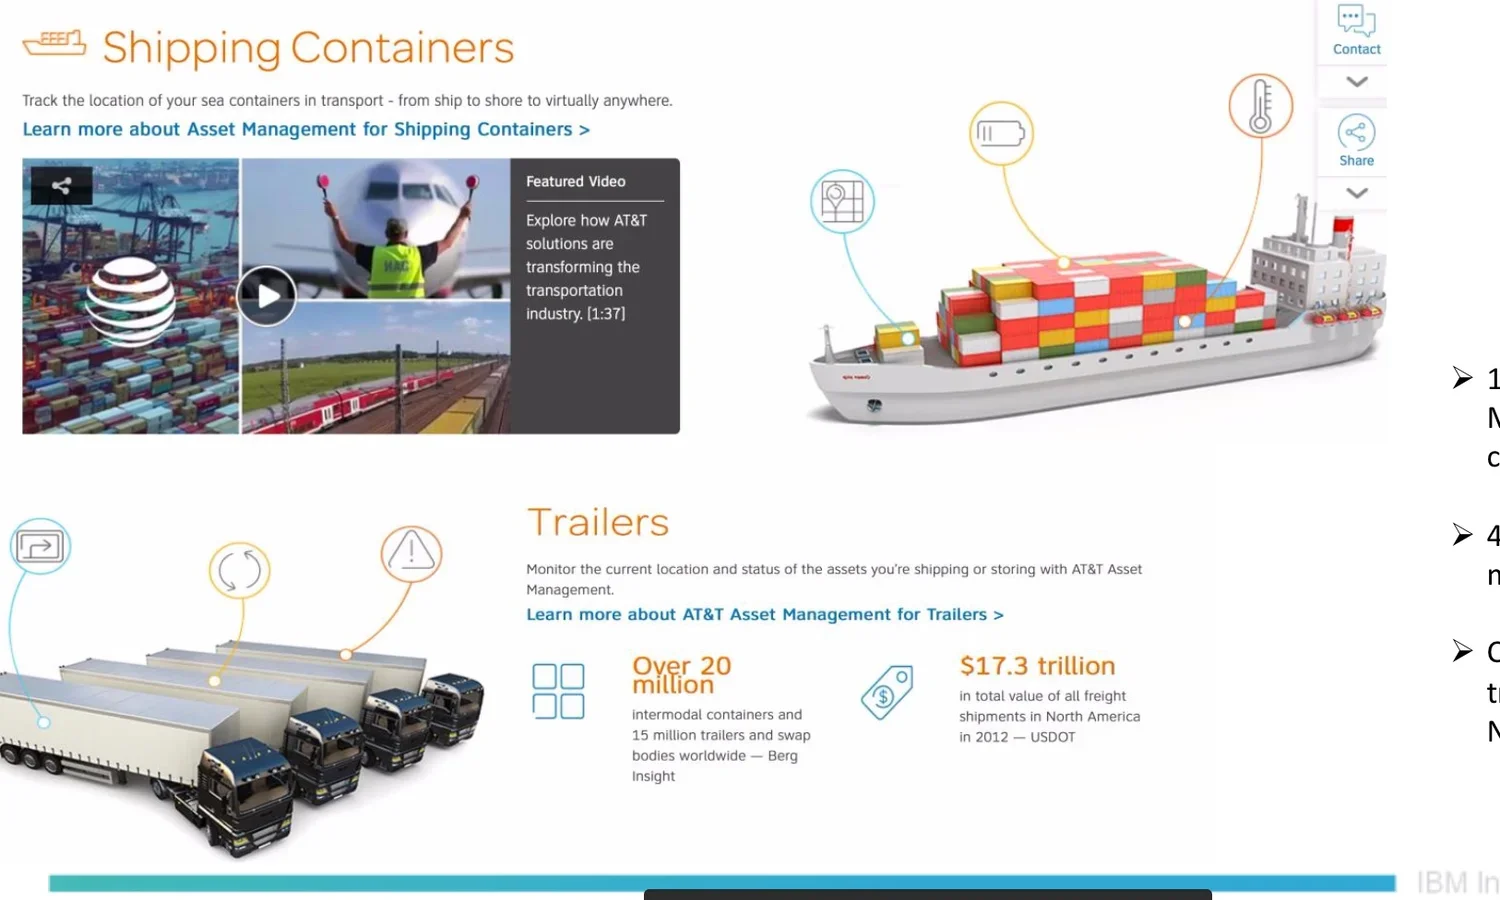
Fewer than 50% of companies currently track assets, yet logistics is one of the costliest aspects of global trade. At the centre of these systems of deliveries of parts, and flows of assets around the globe sit Logistics Coordinators tasked with keeping on top of the complex systems as they evolve over time.
Together, we at IBM and Vodafone set out to deliver a powerful solution to empower Logistics Coordinators to track and optimise their assets as they go around the world.
❋"We make deals with our clients to deliver X amount of products on a given schedule. To do this we agree how many custom containers we need to build to carry them. These often fall victim to loss and the whole system starves".
- Logistics Coordinator Interview Extract
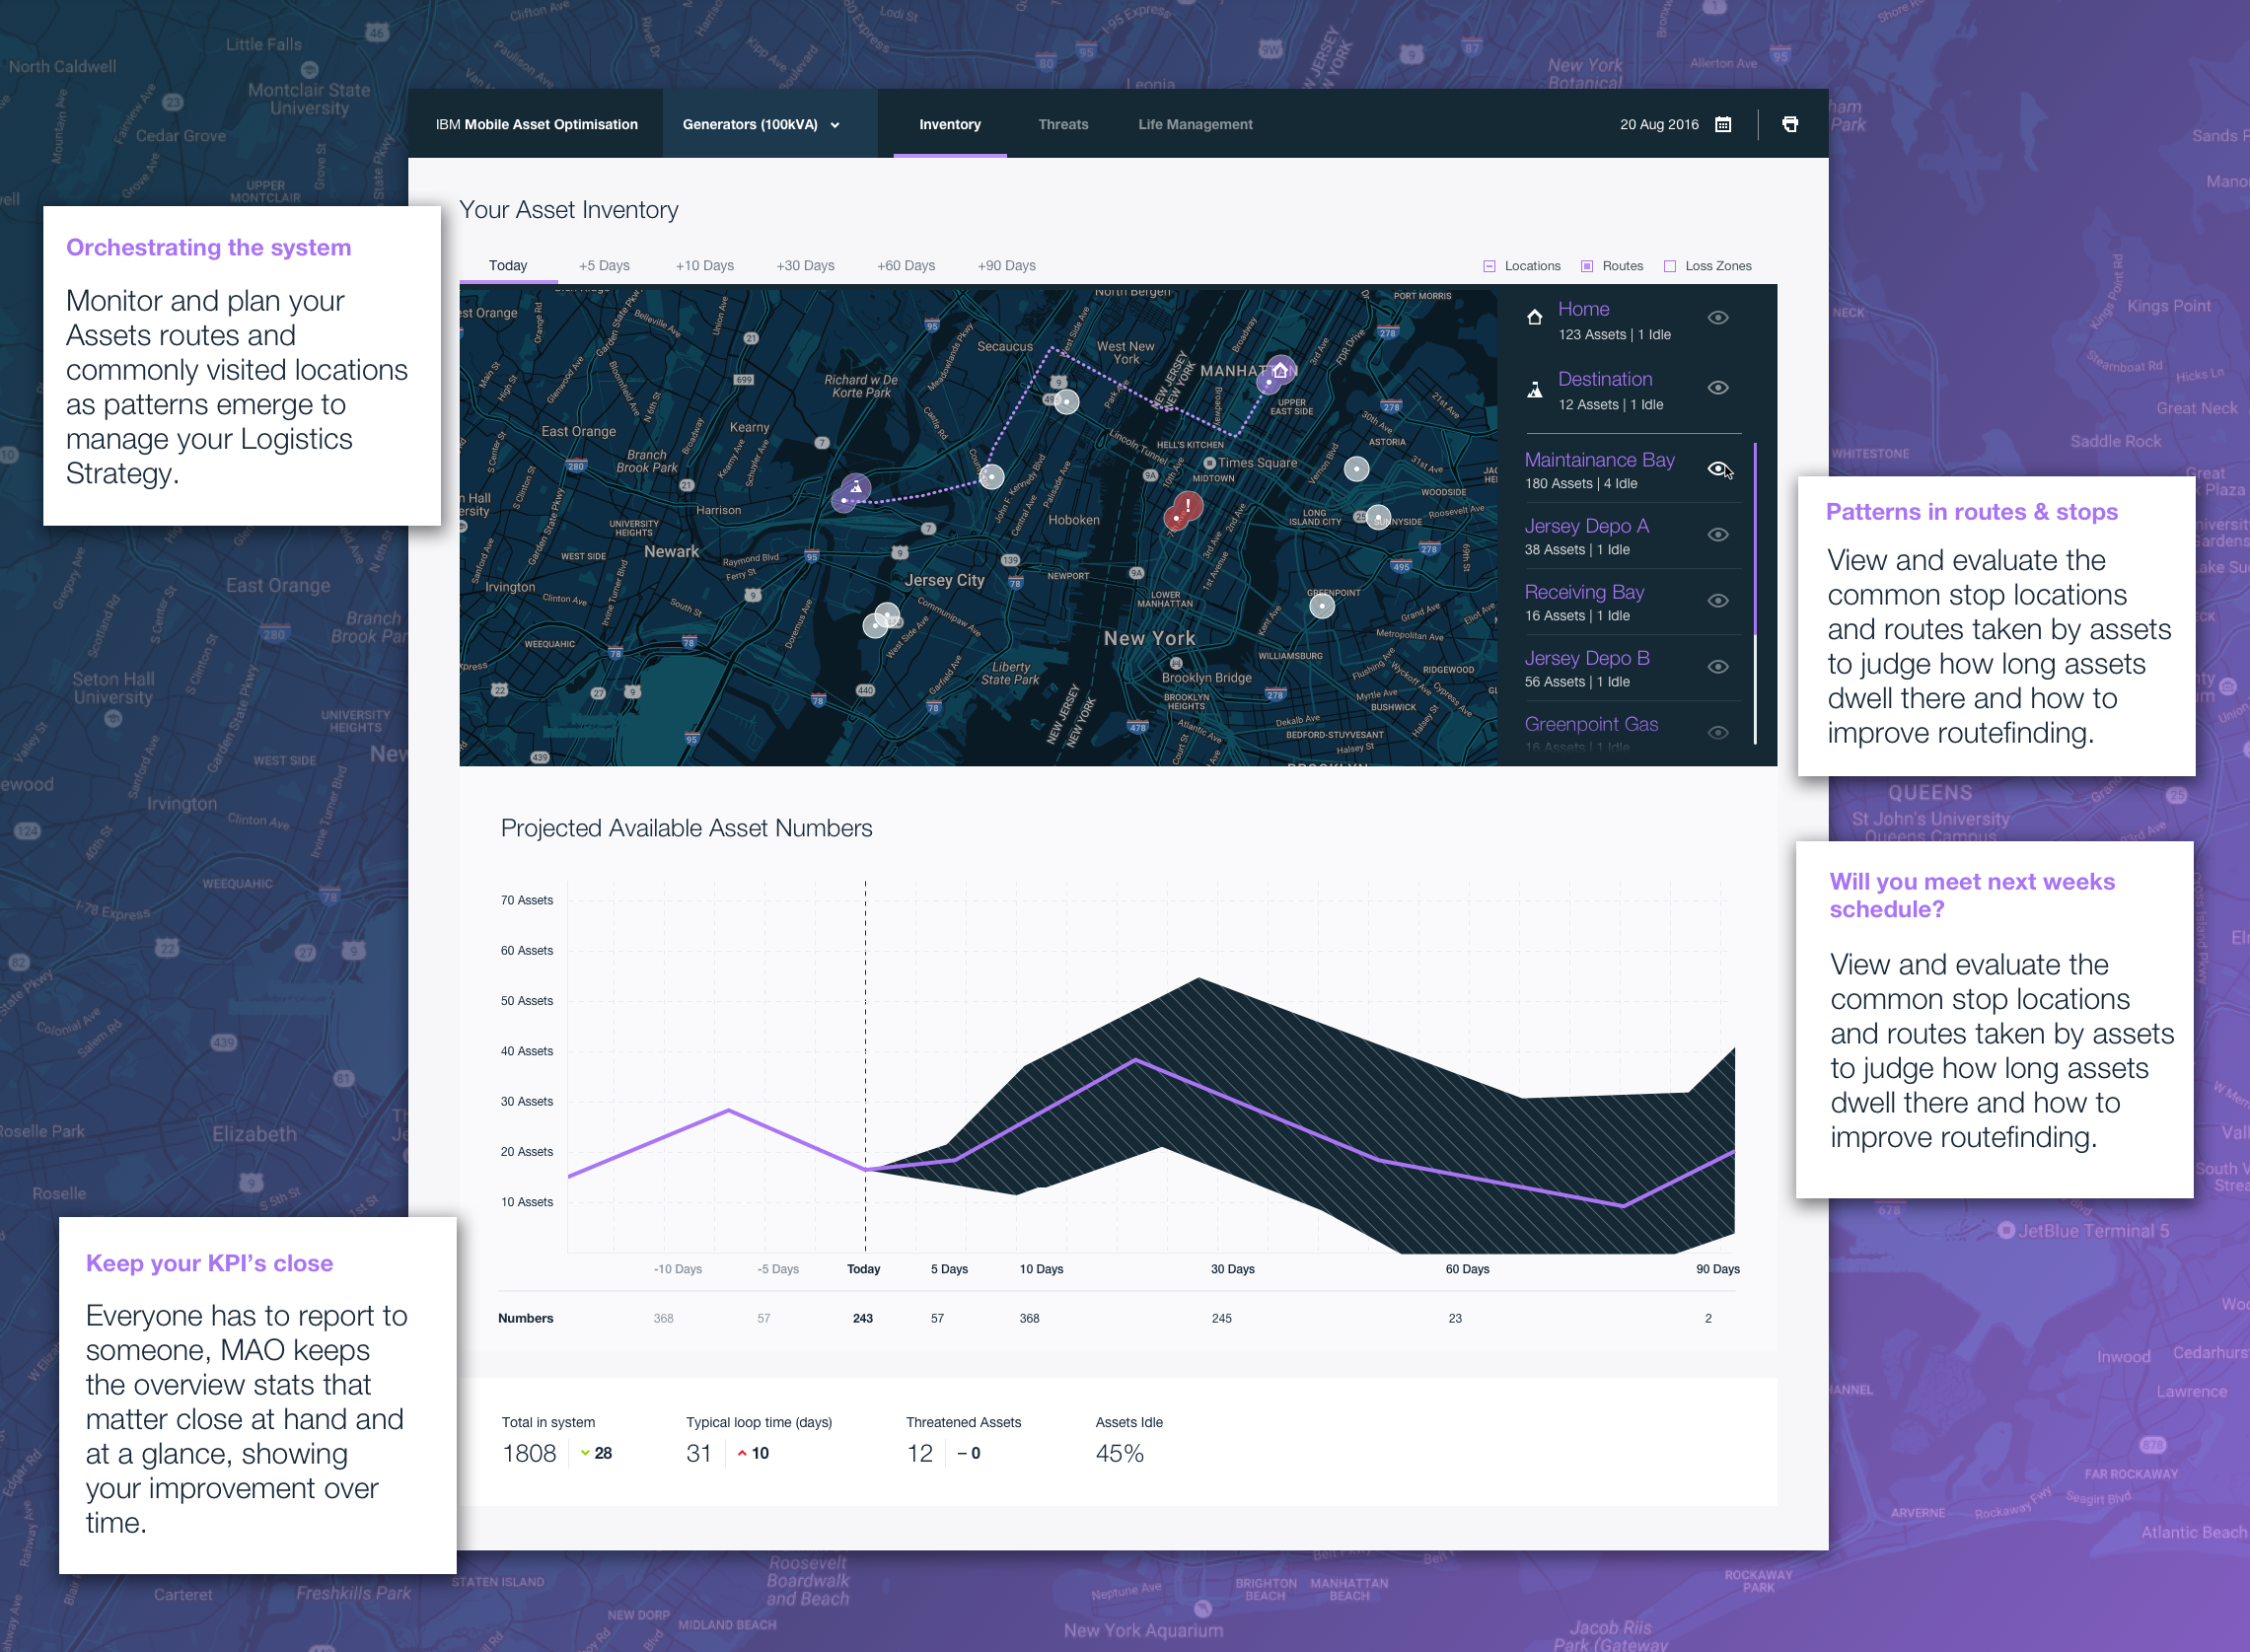
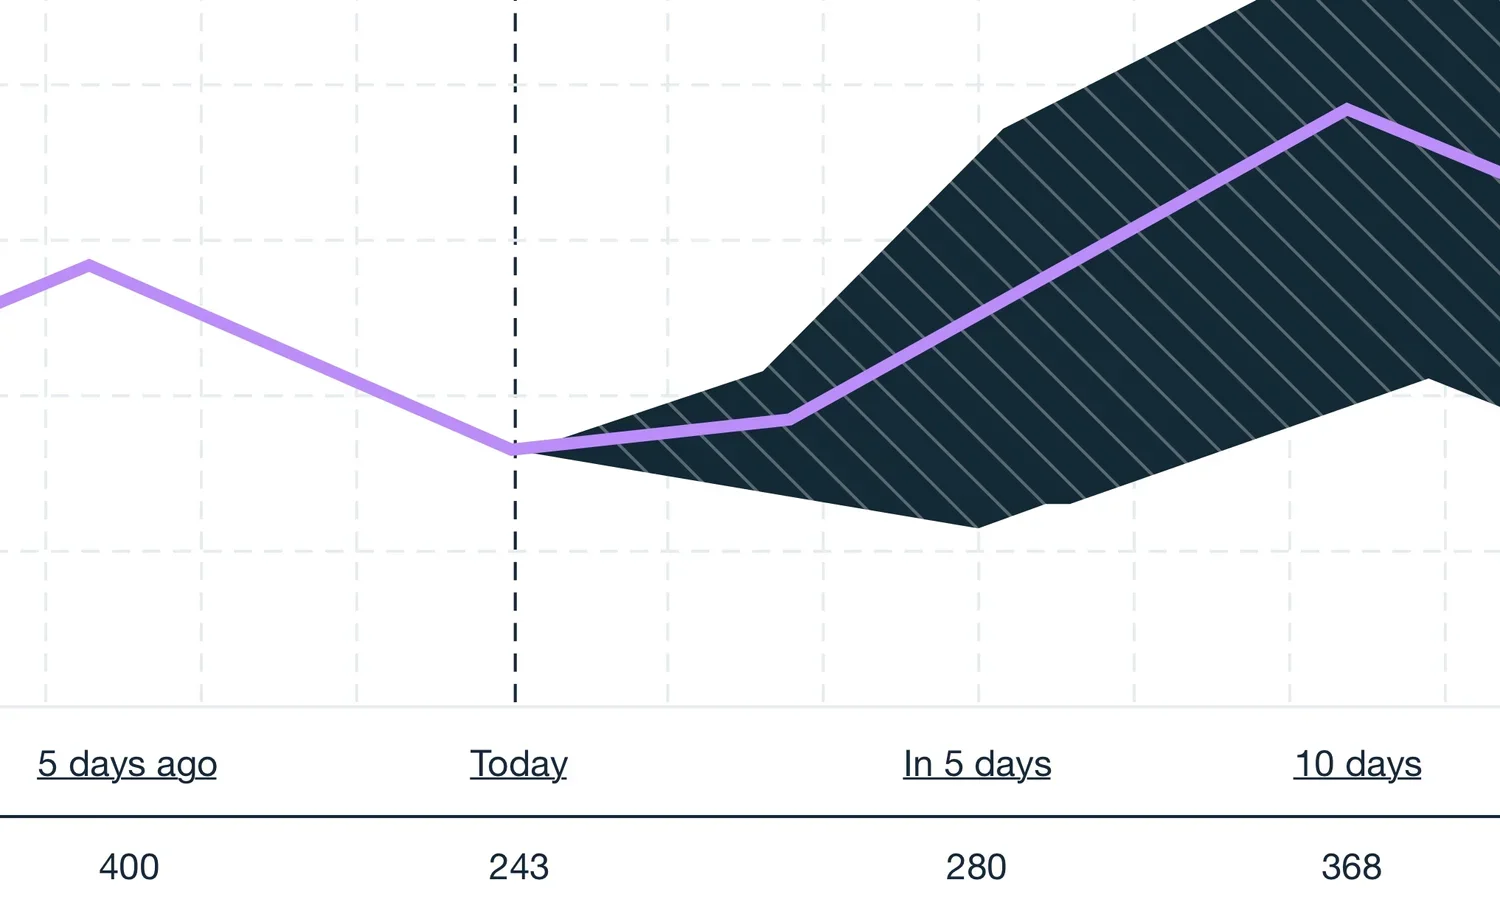
Predict availability and perform 'what if' scenarios to ensure you never miss a deadline.
MAO builds on top of the existing Mobile Asset tracking systems widely used today, taking their historical data to model and learn the ebbs and flows, the routes and the risks of your Assets travels over time and can project forwards how many of what kind will be available to you 5, 10, 30, 60 or even 90 days in advance. Check your schedule, see what MAO says and know if you need to act!
Take the fear out of negotiating contracts.
Is someone not keeping up with their commitments? We learned just how common it is for Assets to become lost (over 10,000 a year for some clients), or suffer from slow turnaround at customer sites and how painful it is to negotiate for new Assets to be added to the system to keep up with demand when this happens.
MAO lets you know how long assets usually stay at each site as well as how long it takes to complete a loop. Now users can take the 'trust me' out of the equation when asking for more.
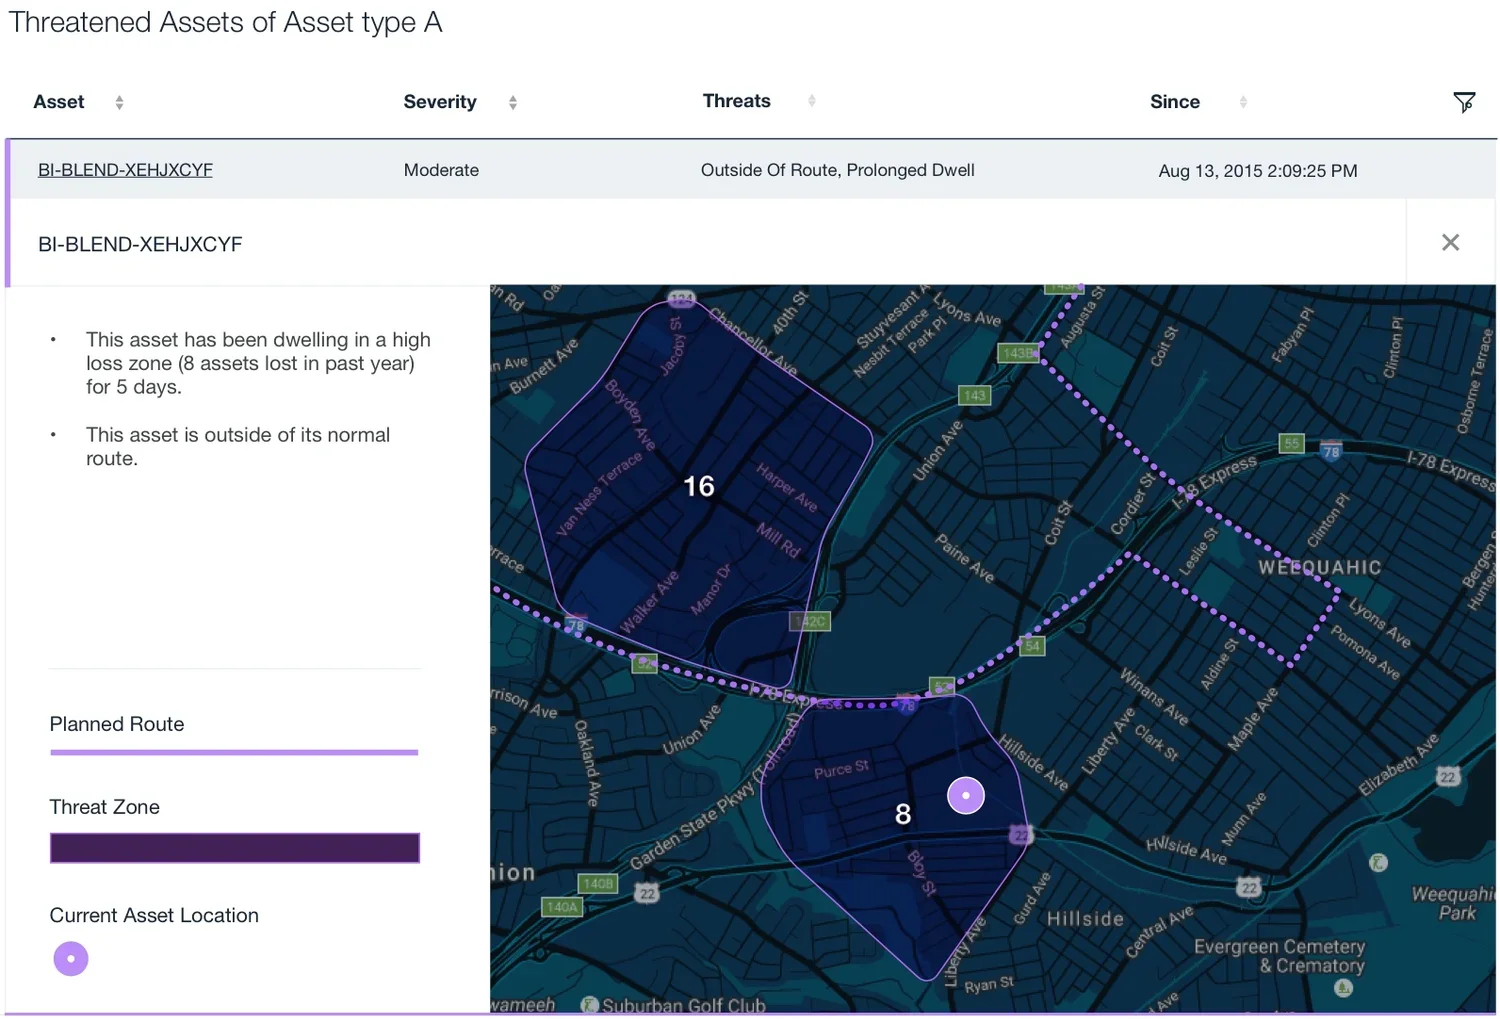
Keep your mind on the ball, not in a spreadsheet.
Clients who track assets, often track them in the thousands if not tens of thousands. And yet Logistics Coordinators have to keep track of each individually with most existing systems.
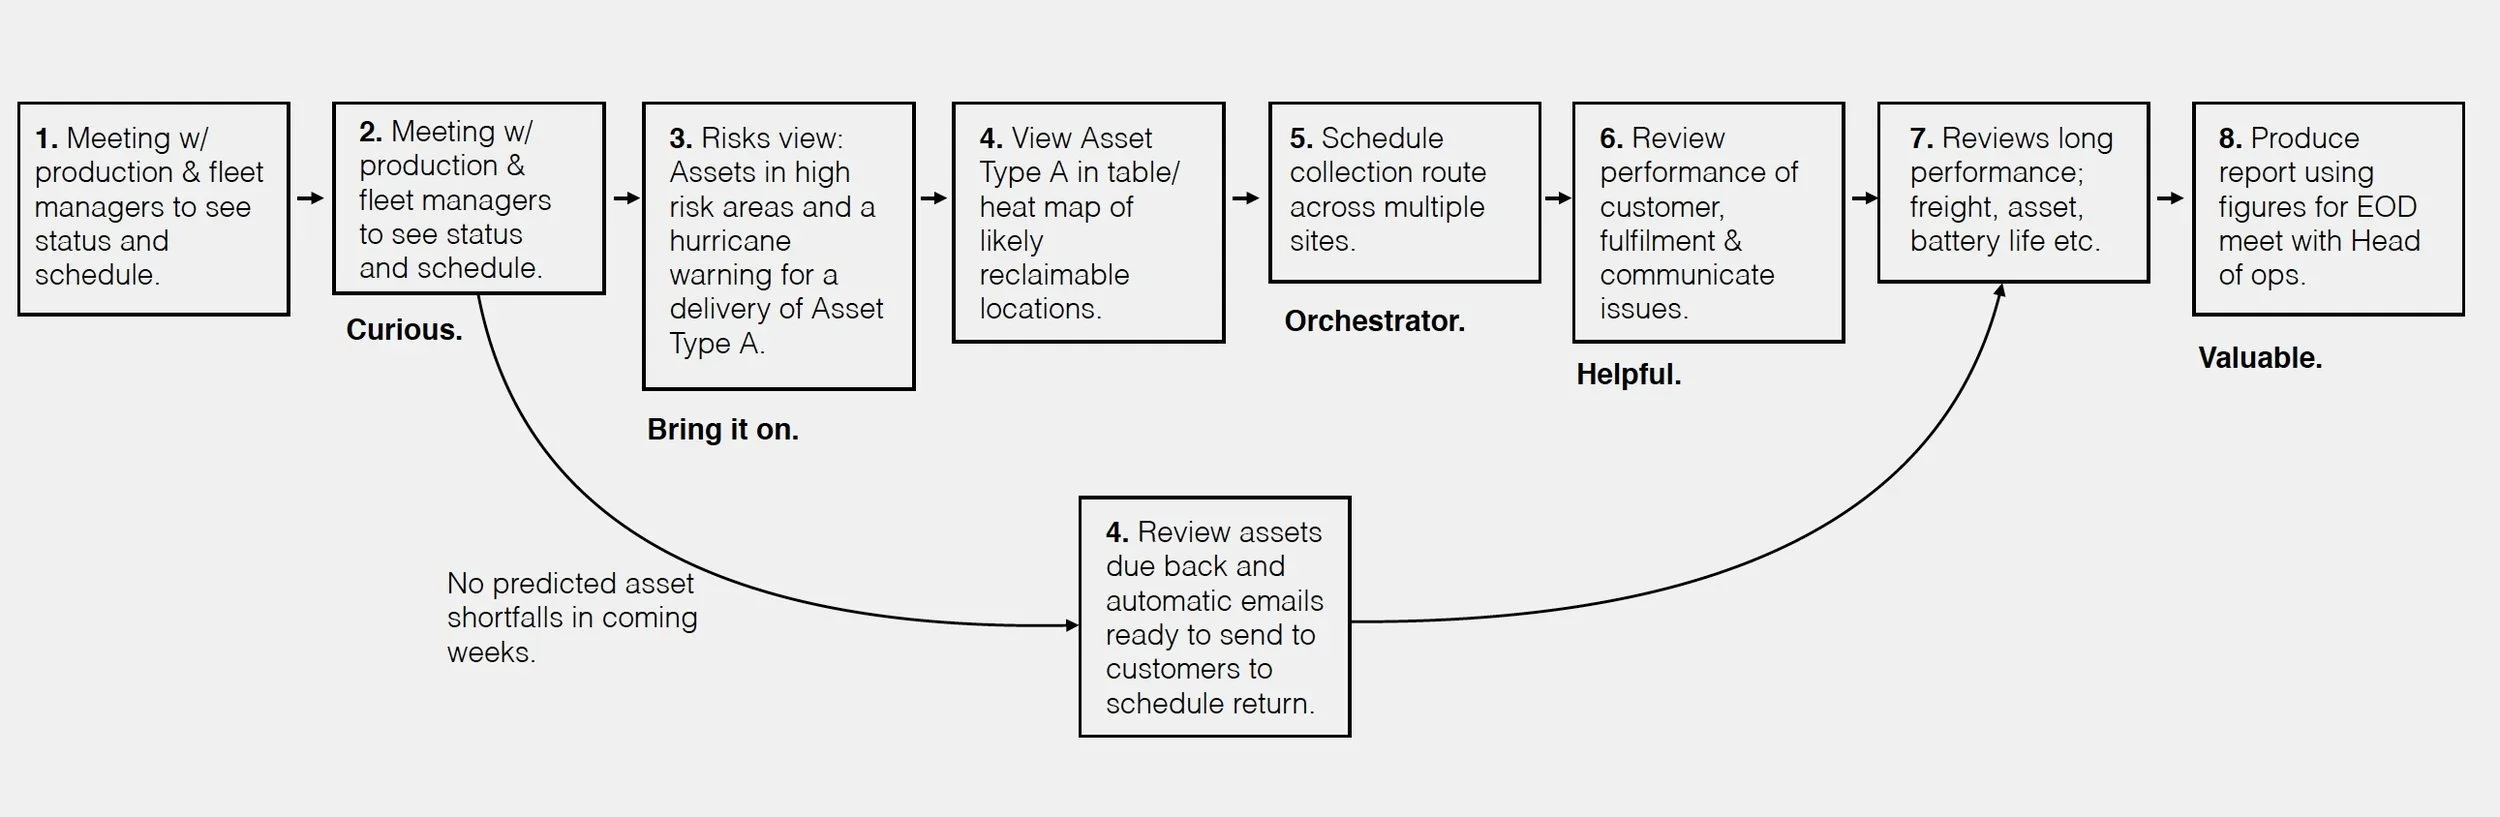
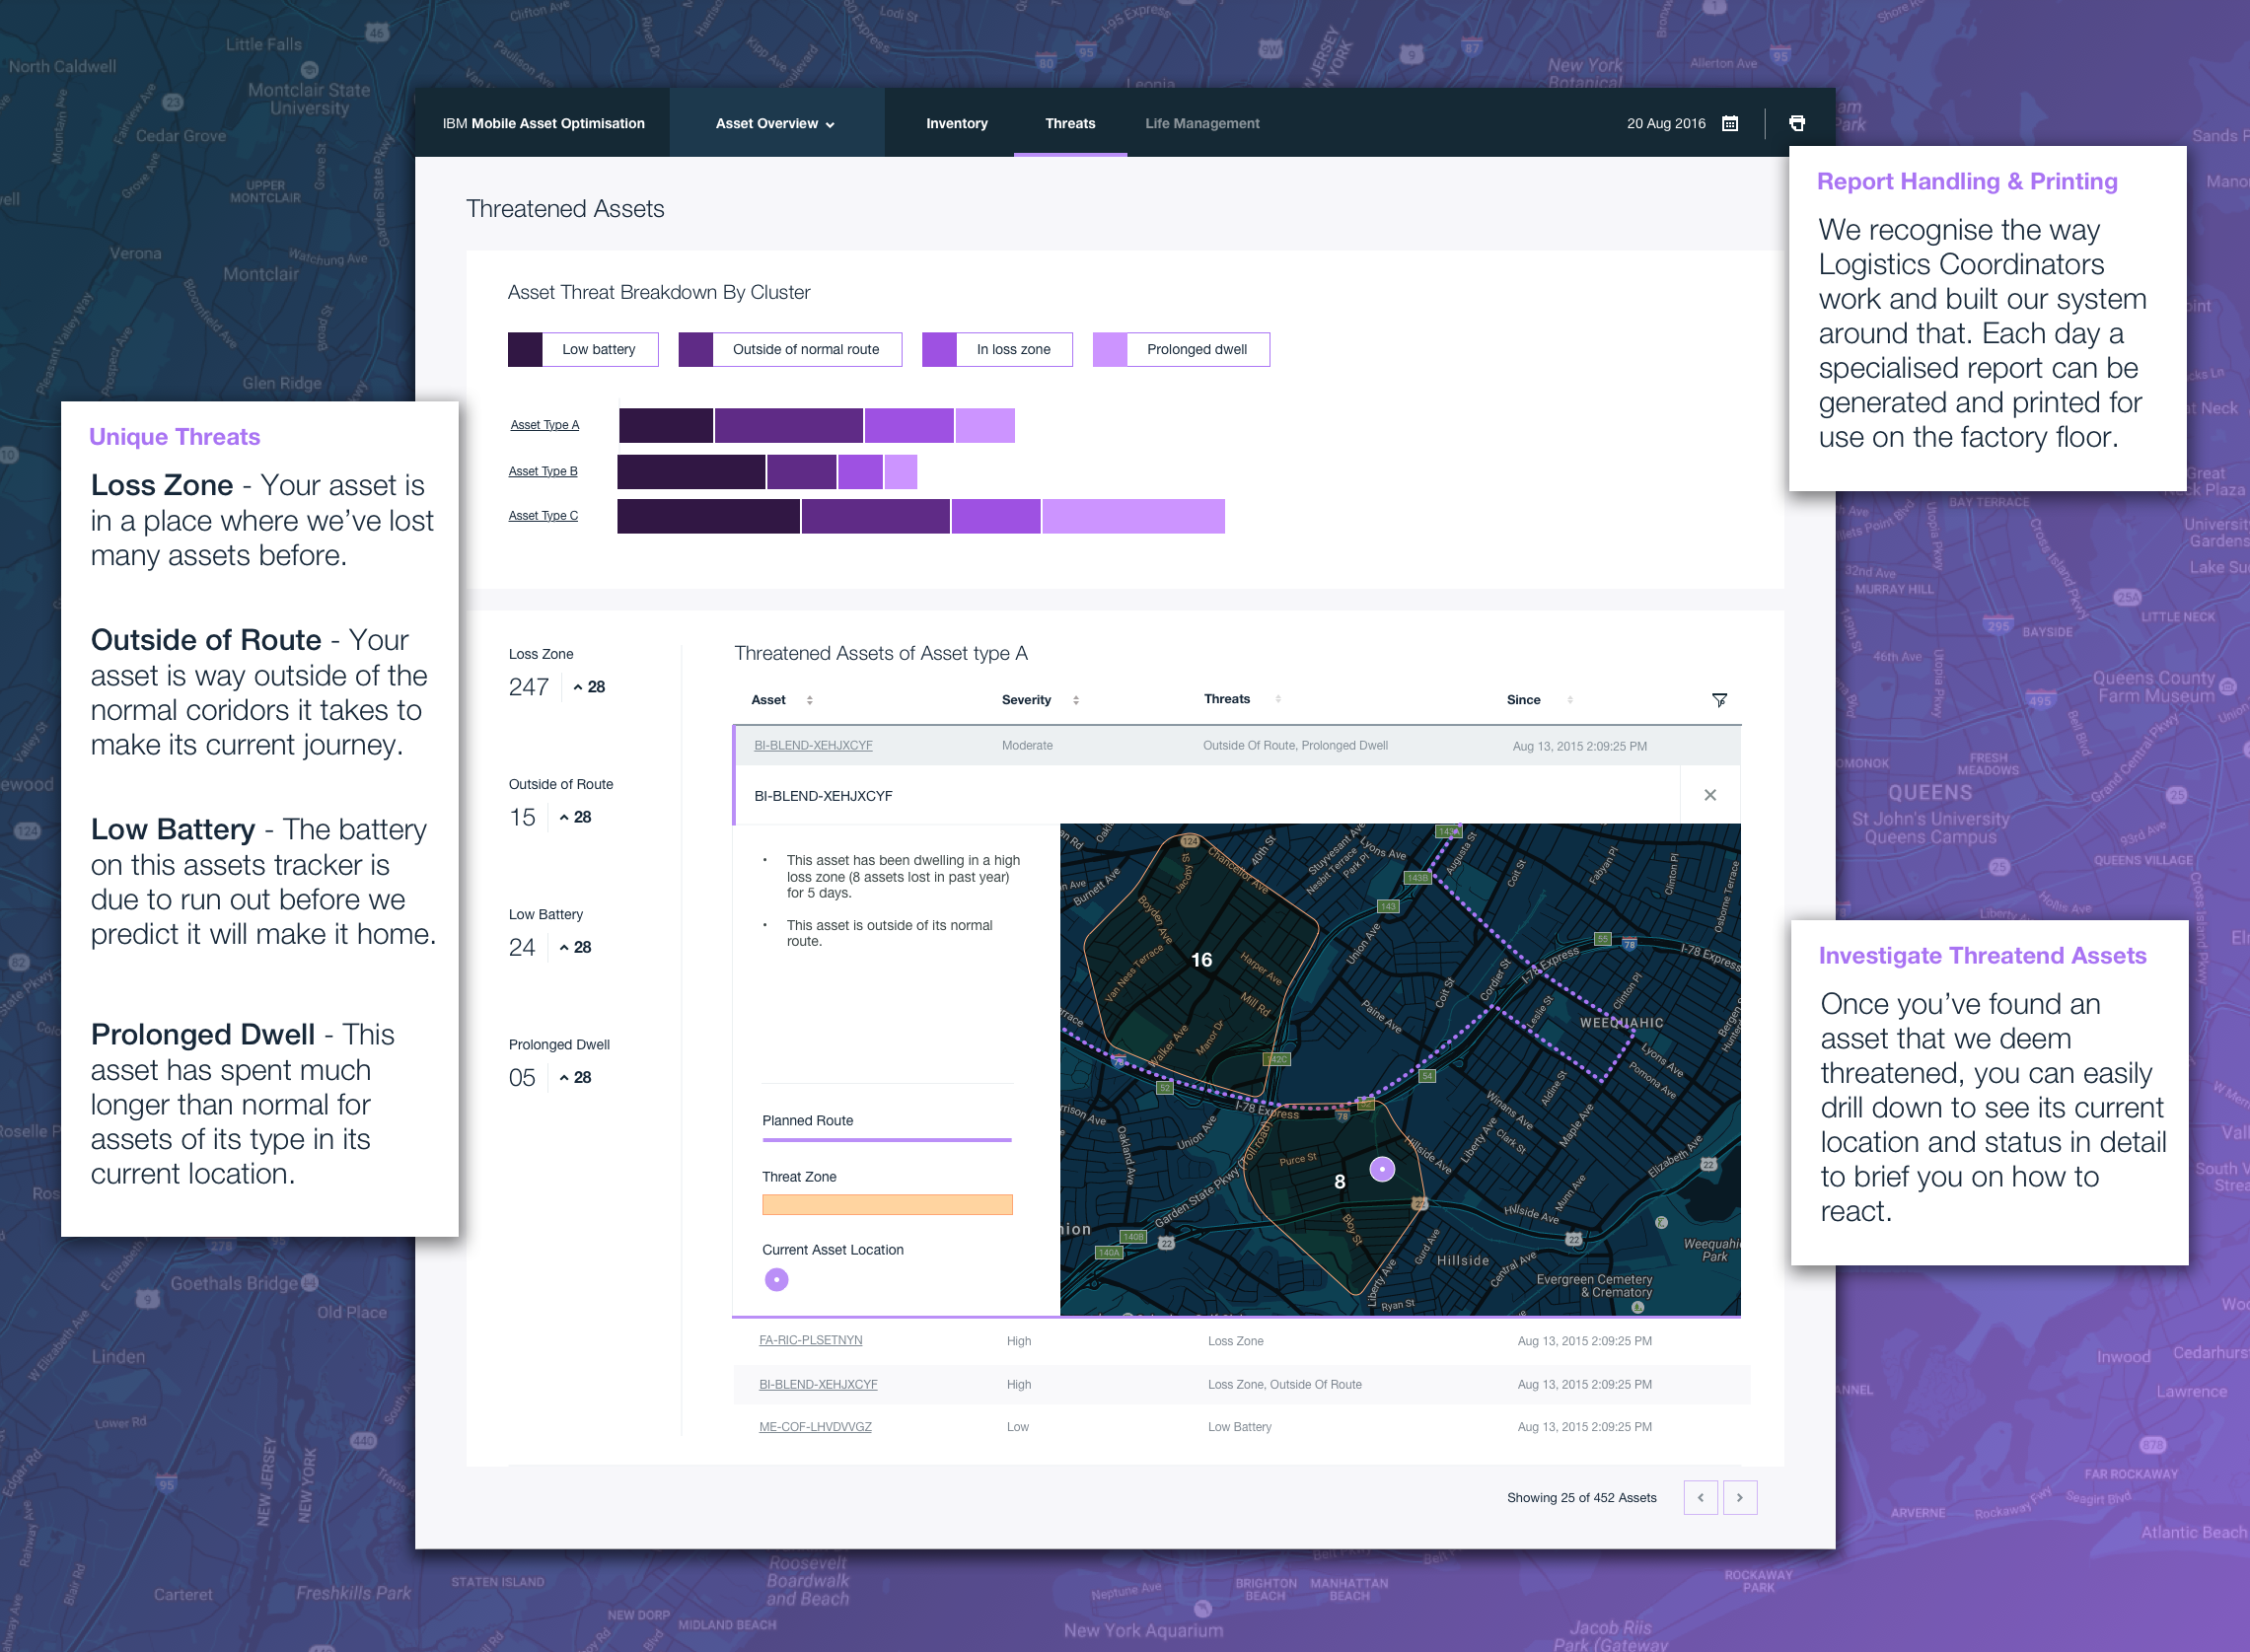
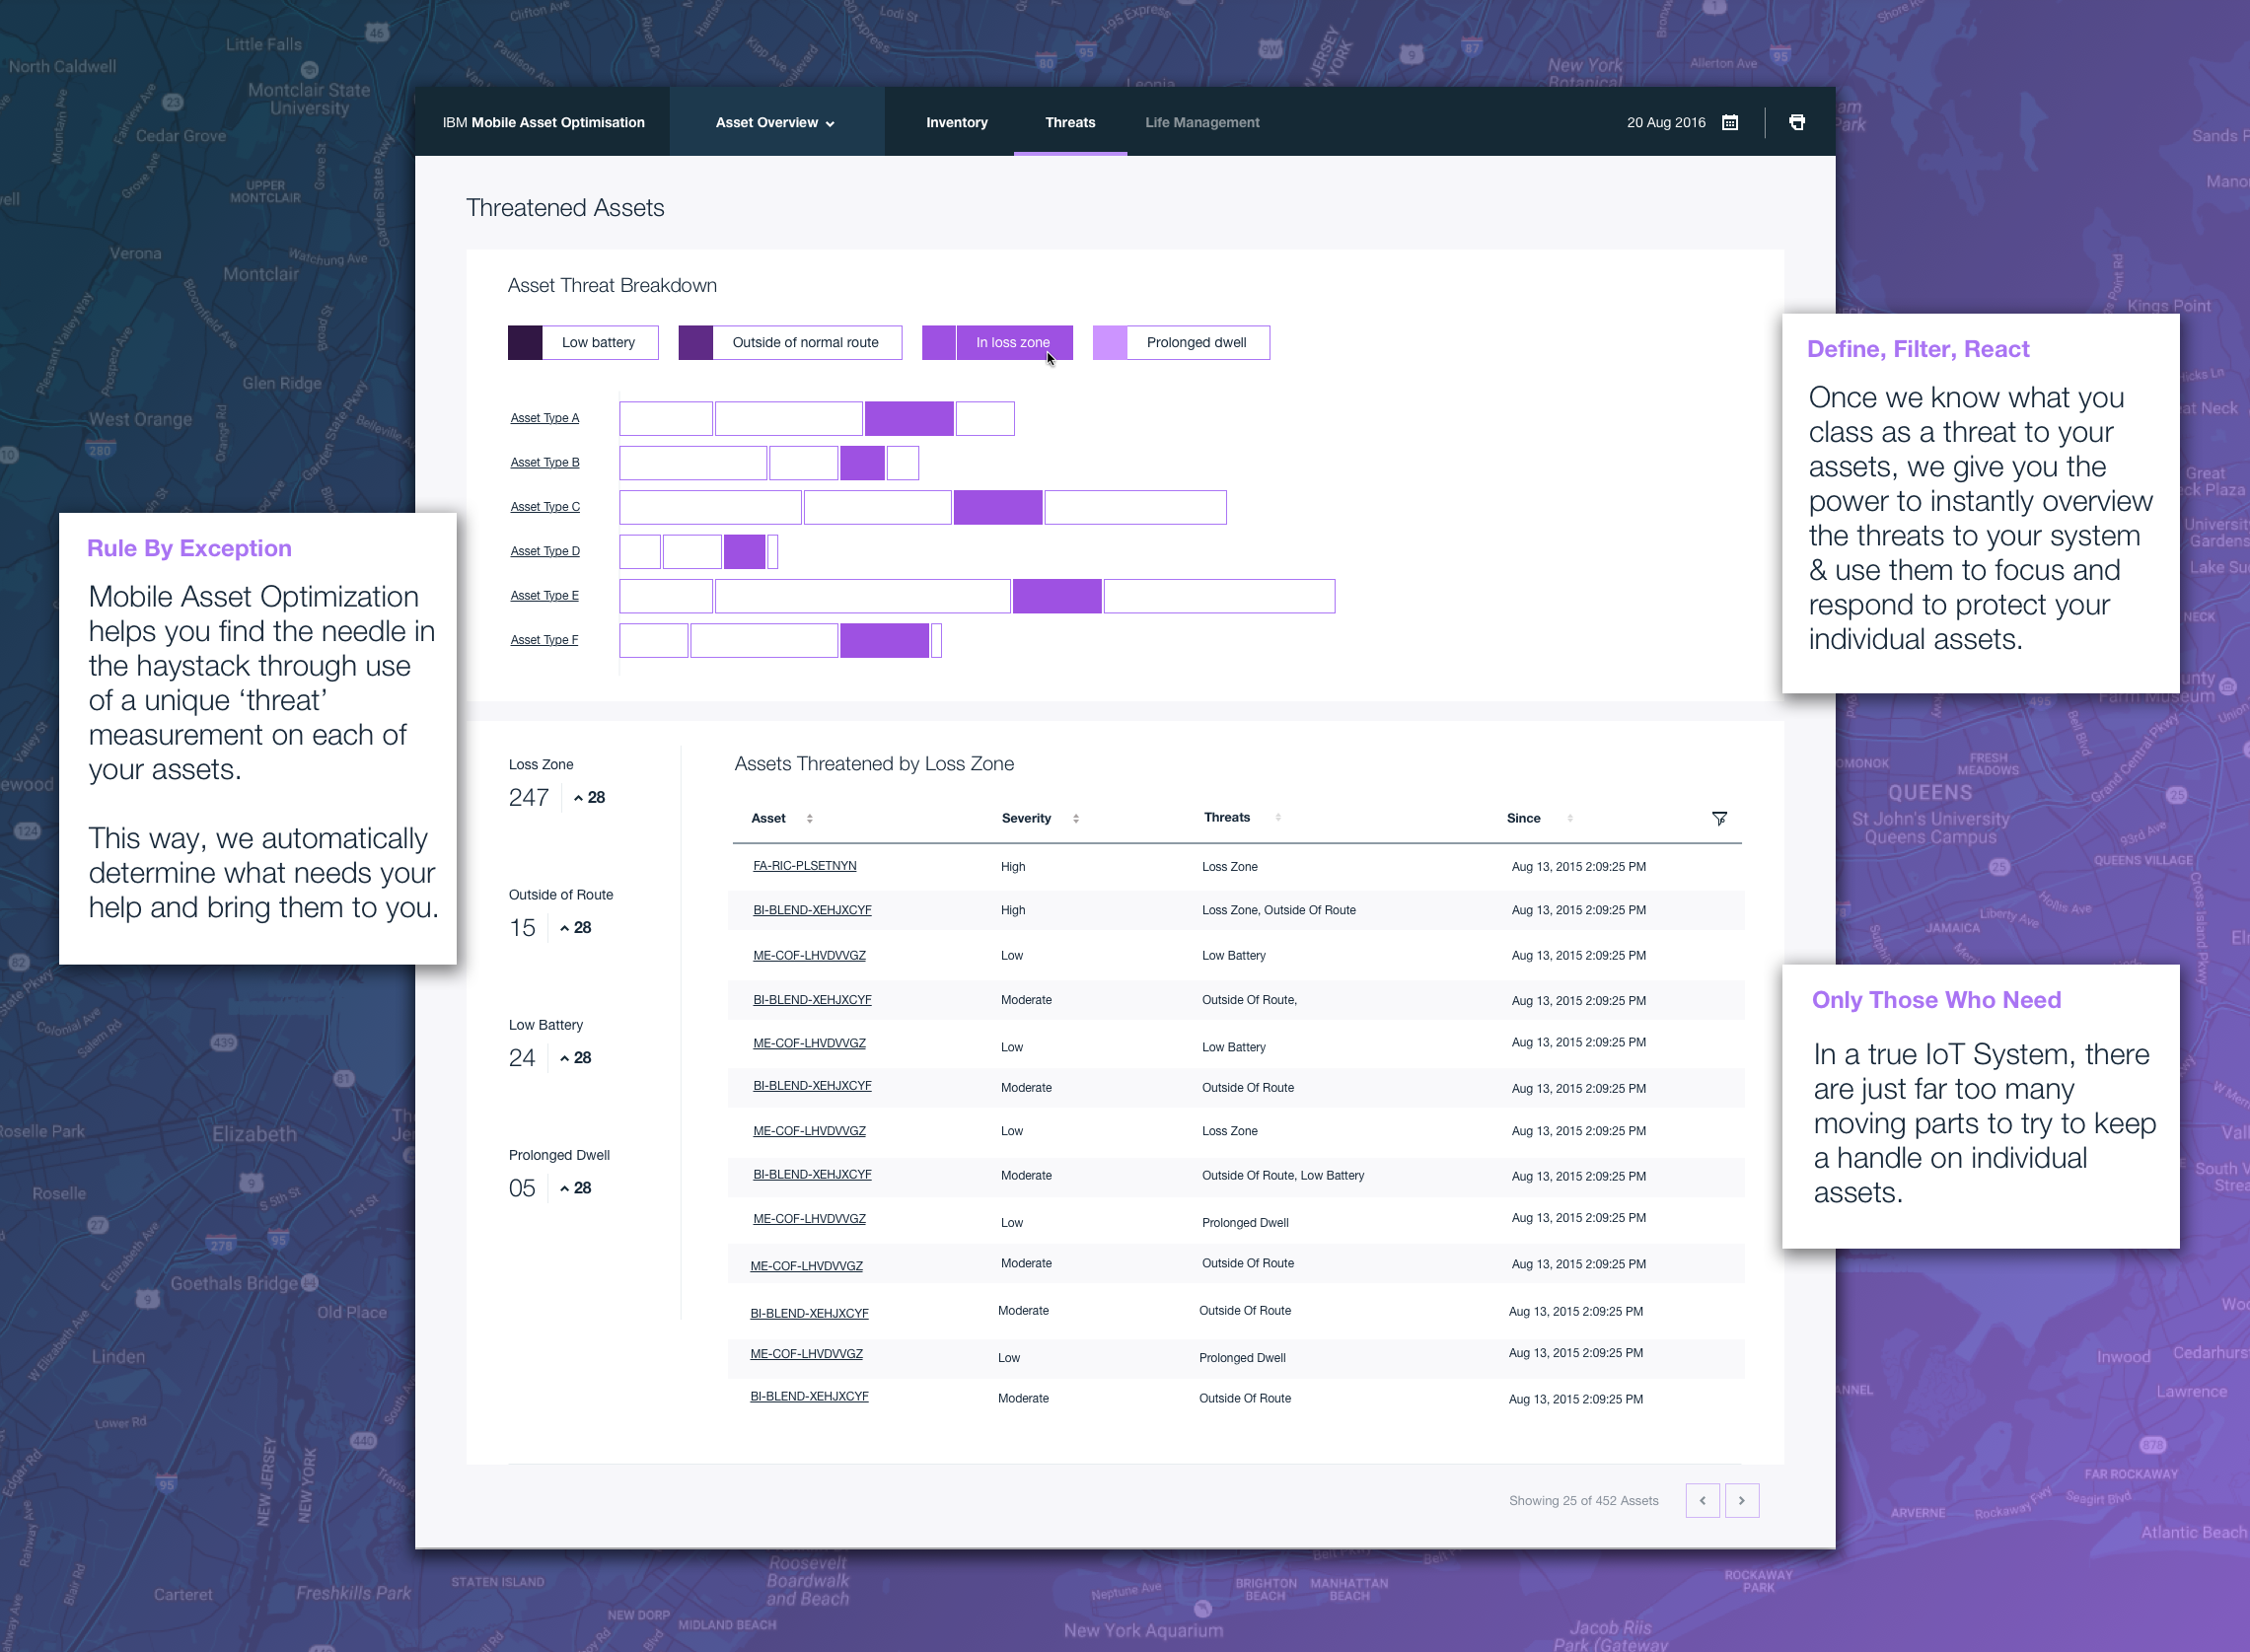
MAO allows users to work through 'rule by exception' - we know when you aren't going to make the next delivery, and when your assets look like they are at risk of being lost and bubble these up out of the weeds and to the surface for you.
Want to see how we did it? Read on ↓
The Design Process

1. Starting Right | Workshop
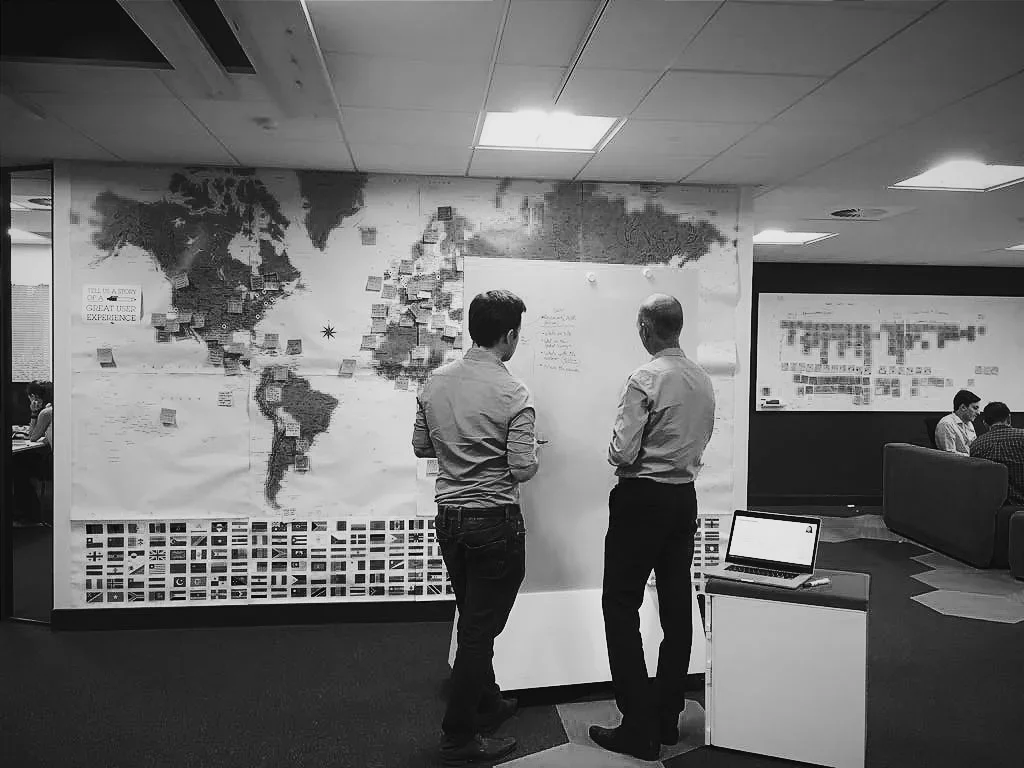
As with any Design led project - we kicked off with an IBM Design Thinking workshop - nearly fully remote using tools such as mural.ly and video conference.
Here members from IBM and Vodafone came together and learned first about the world of Logistics tracking, before defining a stakeholder map and narrowing down to our key persona - Laura the Logistics Coordinator.
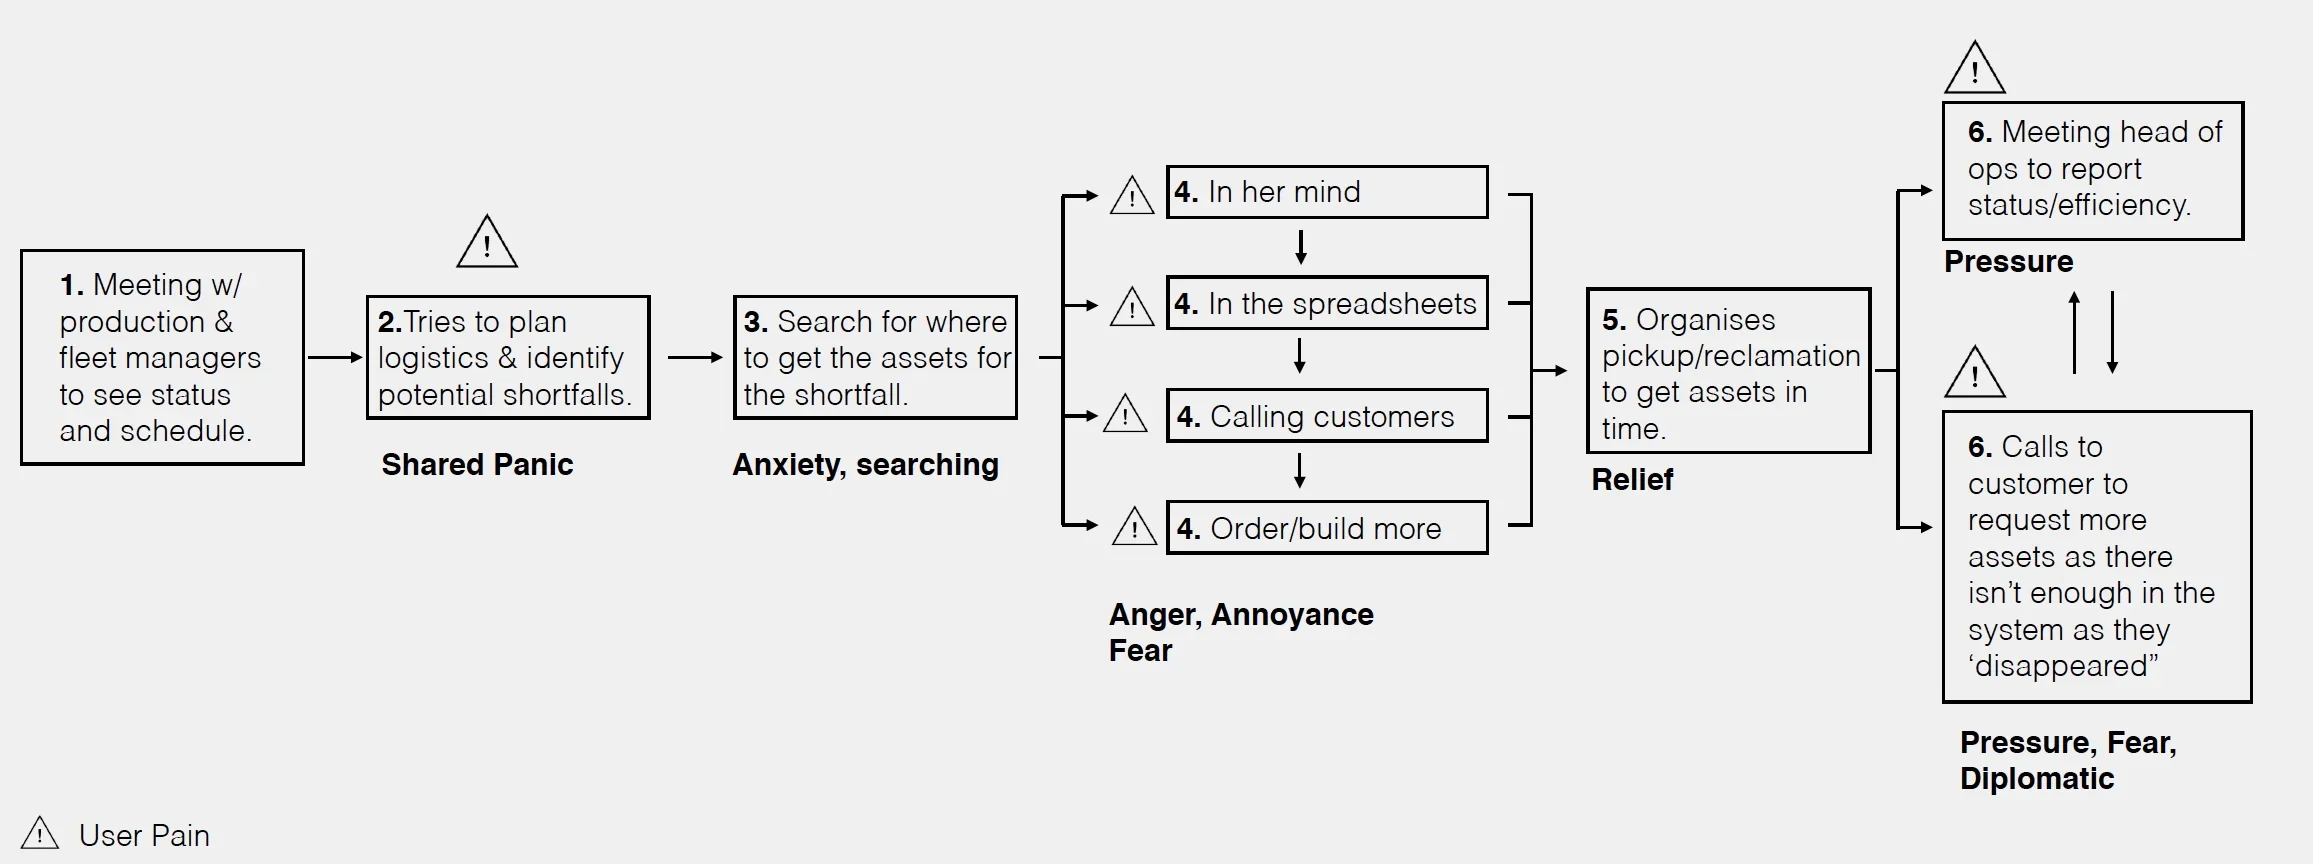
After this, we built empathy through hearing about Laura and her current experience, mapping it out with painpoints, before generating blue sky ideas on how to help her before bringing in the right people from across the business to tell us what was possible and defining our roadmapped 'to-be' experience that would make Laura's life perfect.
From this, we all left with a target in mind, ready to get started.
2. Whats Wrong Today? | Research & Understanding
Alongside the broad scope of IBM IoT specialised knowledge in the room and workshop, we were able to have a number of key touchpoints and SMEs from the world of Mobile Assets as parts of the team to keep us on track:
2.1.
One Vodafone team member who was integrated with our first target client, attended and played a pivotal role in our research and understanding - taking away key artifacts from the process for testing with real logistics coordinators to bring back their opinions and thoughts.
The current user experience
Scaling Asset Types
As her enterprise scales, so do does the complexity. Laura has to keep track of easily over 1000 Types of Asset to manage & keep track of stock levels.
2.2.
MAO is built as a 'level up' upon the foundation of Vodafone's Mobile Asset Tracking Platform and the Watson IoT Platform. A key member of the team working closely on site was the current Offering Manager of Vodafones existing product with years of knowledge in the space.

Locating Assets
Understanding of stock is particularly difficult, with fluctuating numbers of assets of different types at many locations.

Orchestrating Supply
Laura keeps the huge evolving system in her head, but resorts to piles of reports and excel sheets when in desperate need.

Asking For More
Averaging at $600 an asset, Laura has a hard time convincing partners to purchase more when they run low without proof it’s not her company that is at fault.
Project goals

Hill 1
Laura the Logistics Coordinator can understand if the current asset flow/loss will require reclamation/additional purchase of assets for the coming quarter.
Hill 2
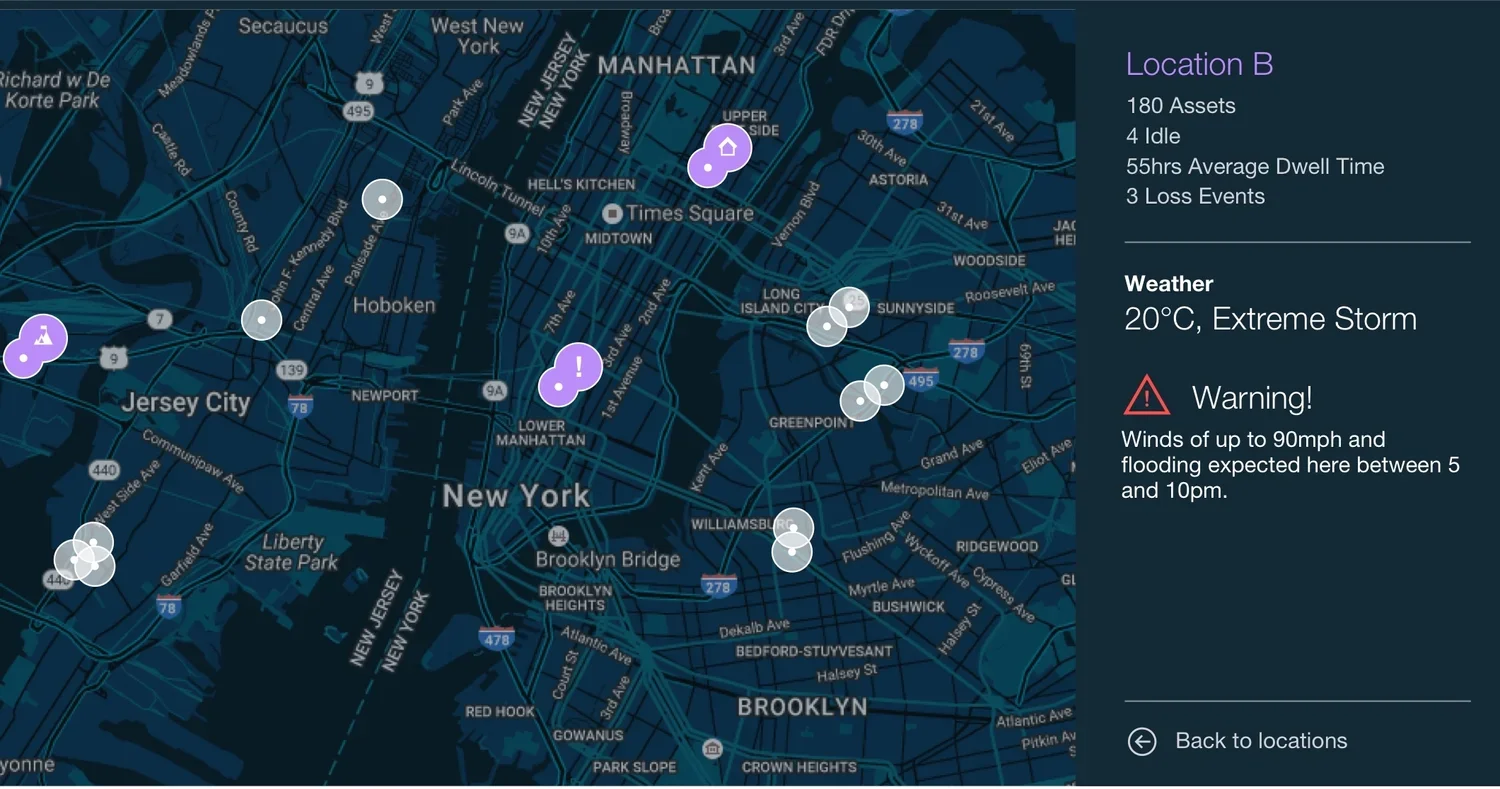
Laura the Logistics Coordinator can react to anomalies affecting her asset availability over the next 5-10 days from multiple sources.
4,5,6. A Looping Journey Through Fidelity, Testing and Prototyping
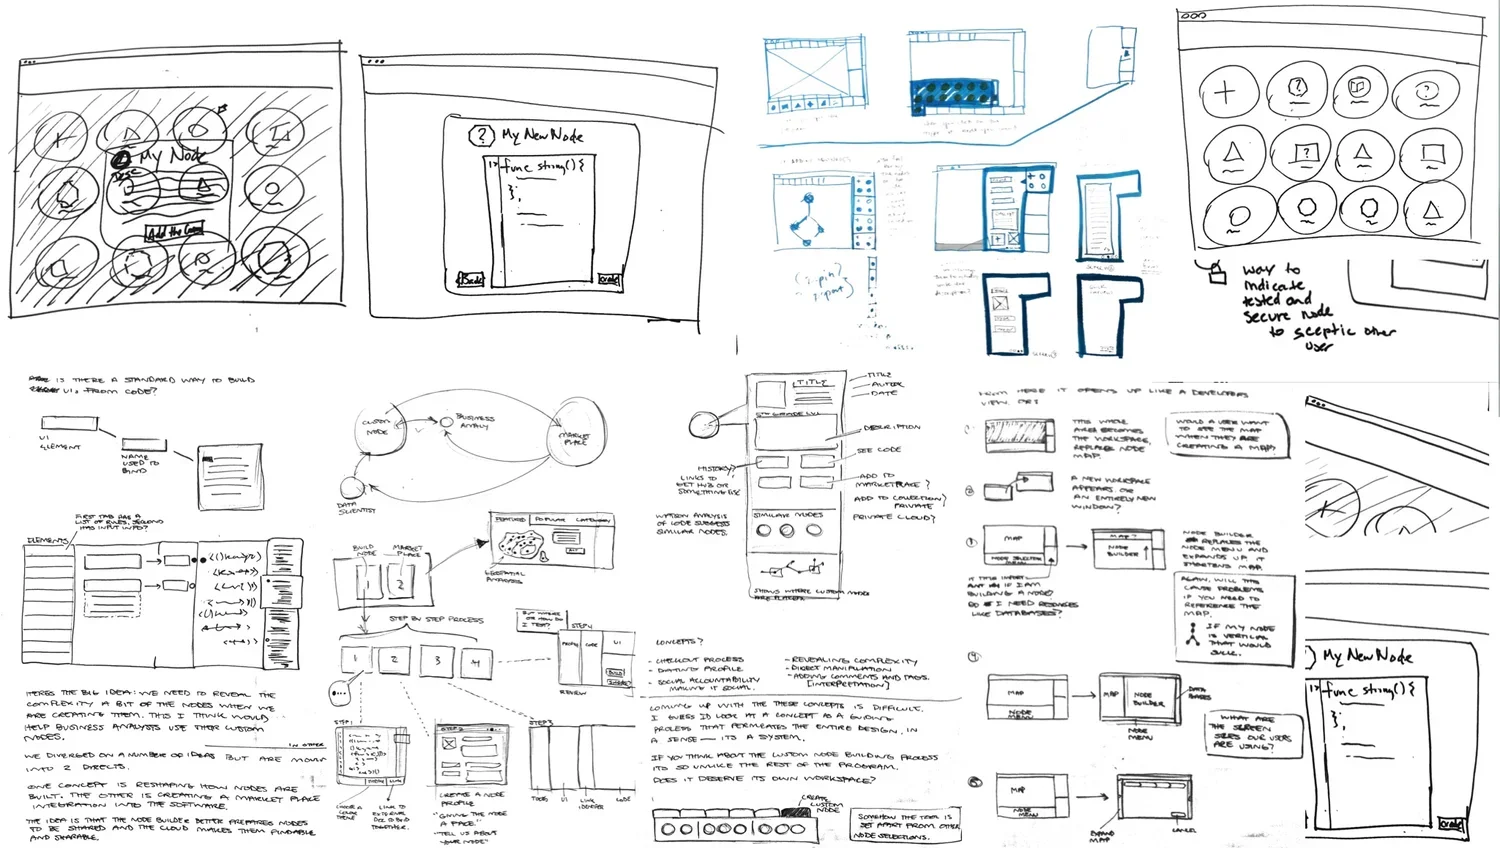
Lo Fidelity Experience Prototyping
Defined the experience from an early level strategy point of view and kept up the momentum with the team. It was here that we rapidly uncovered the need to 'rule by exception' - rather than showing users every assets at all times, only bringing them assets that require attention and the data they need to know if they will make their quotas.
Compromising As Single Agile Team
As we worked up fidelity, the UI was already being prototyped and any capability changes or additions were carefully communicated to the DataScience team, who in turn communicated to the Team when things they aimed for couldn't work or needed to be changed.
Even our mid-fi UX was extensively used in Marketing playbacks!
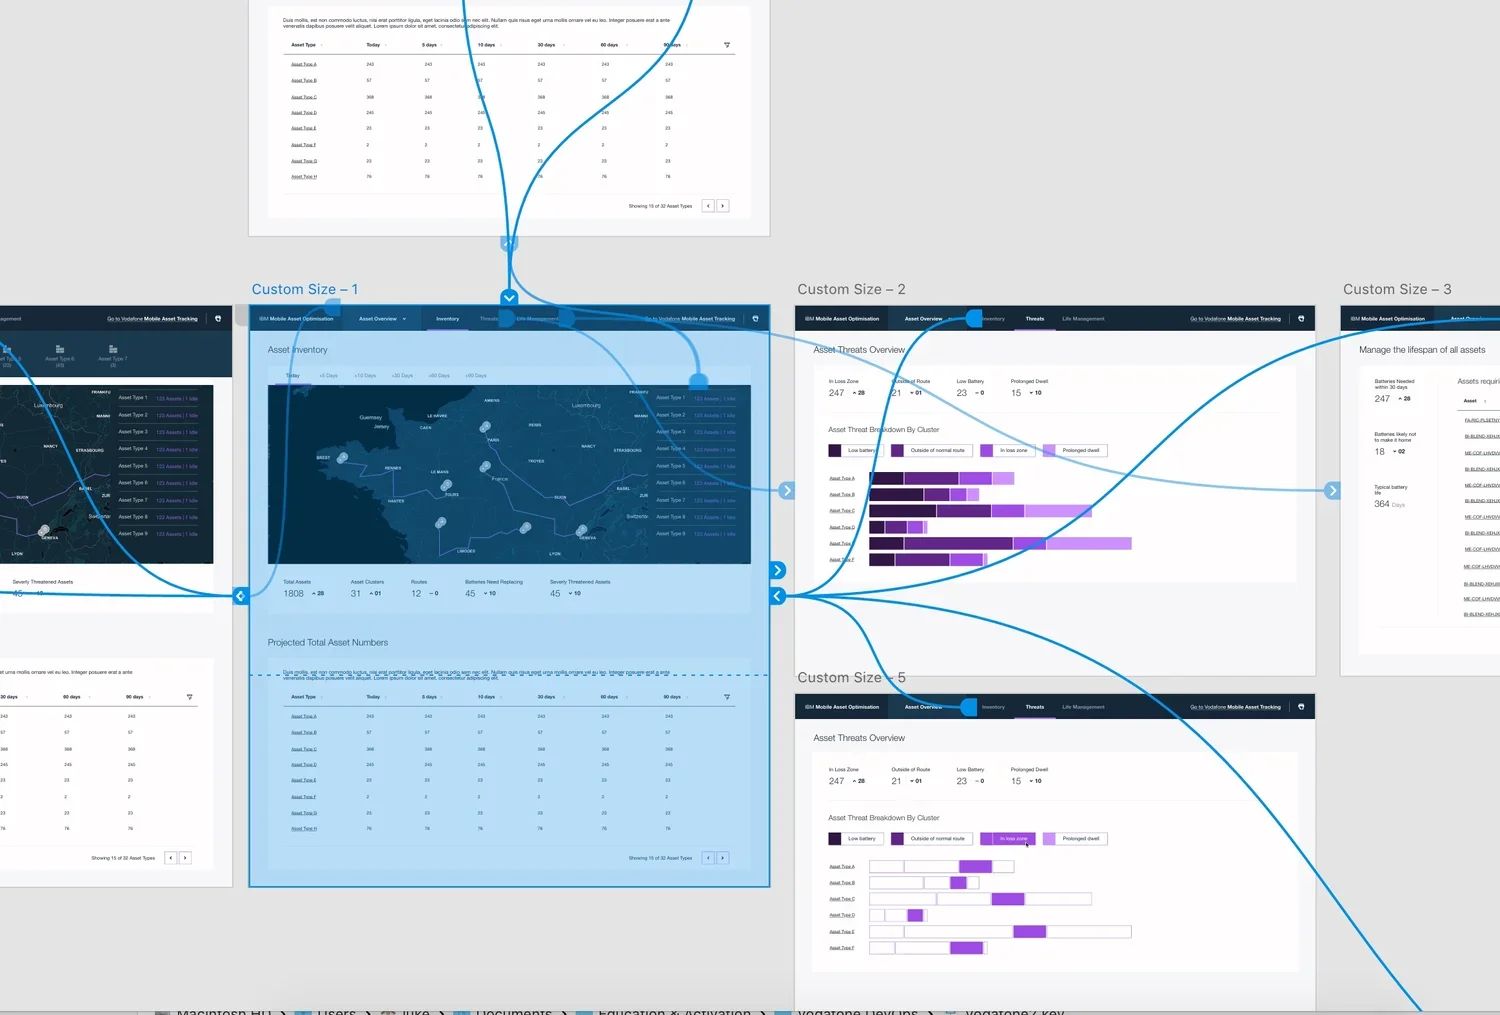
Testing testing and more testing.
Layers of clickable prototypes, tested and tested and tested again. It was these that formed the first layers shown to General Management in IBM and Vodafone IoT Execs.
7. Meet IBM & Vodafone Mobile Asset Optimization in its Cupcake Launch!
A demonstration video to launch our solution, found on youtube alongside many marketing videos. This same demo (in its clickable form) was also part of the Genius Of Things Launch event for the Watson IoT Munich Headquarters.